By @Cryptick1 12-27-18
Summary:
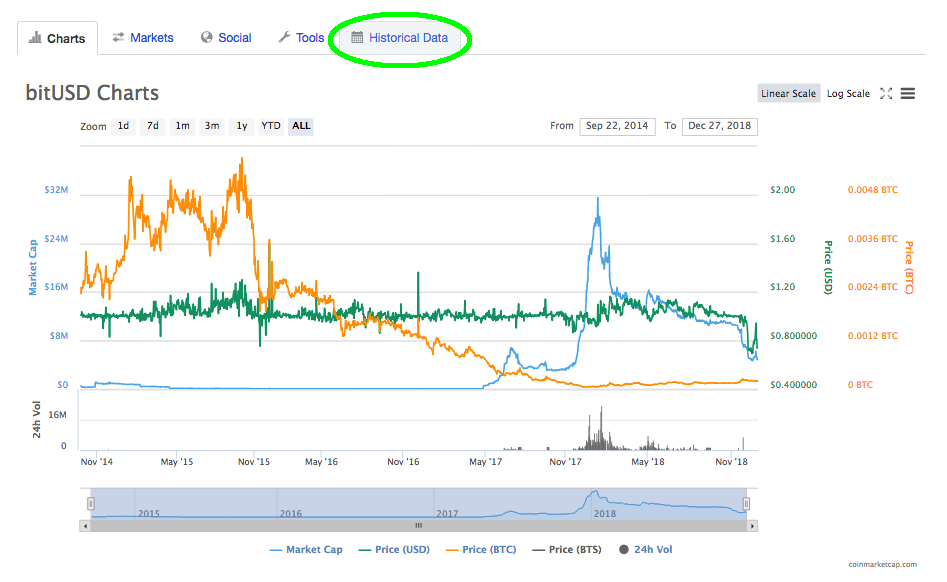
Around November 24, BitUSD went into Global Settlement on the BitShares Decentralized Exchange. Understanding the factors that lead to and contributed to the this settlement is important for planning and to help ensure that it does not happen in the future.
While there are numerous contributing factors, this report wants to highlight liquidity and trading patterns that may have substantially contributed to global settlement. It will show traders moved away from trading in BitUSD and towards BitCNY, while debt remained outstanding. This may have made BitUSD market illiquid compared to the total debt.
Intro
The global settlement trigger of BitUSD was not a failure. It was a planned feature of the BitShares protocol design. This was foreseen by the protocol developers in order to ensure fair and equitable treatment by all participants. There are numerous factors that may have contributed to global settlement of BitUSD.
Factors: Why Did BitUSD Settle?
OBVIOUS:
- Feature Not Failure (It was supposed to…)
- Lowest account no longer had enough assets/could not sell
- Too much selling of the collateral BTS token
- BitUSD is subject to BTS price fluctuations
- Not enough trading in BitUSD
TECHNICAL
- Drop in volume on BitShares Exchange
- See charts.
- Large and rapid drop in whole cryptocurrency market.
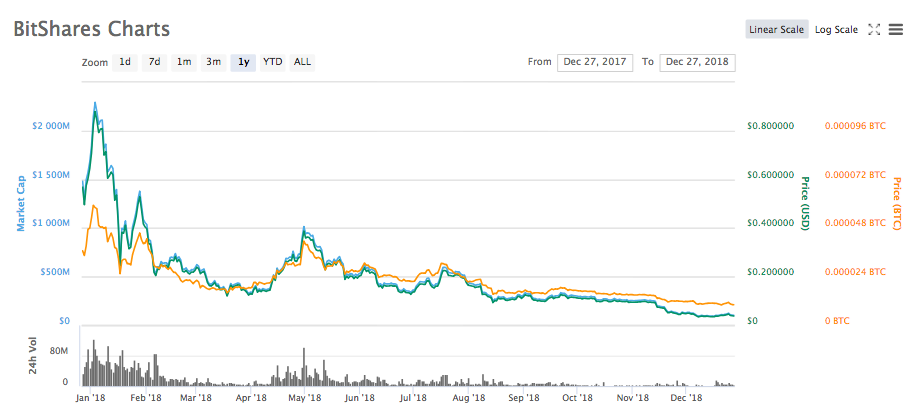
- BTS dropped from near $0.90 to $0.04
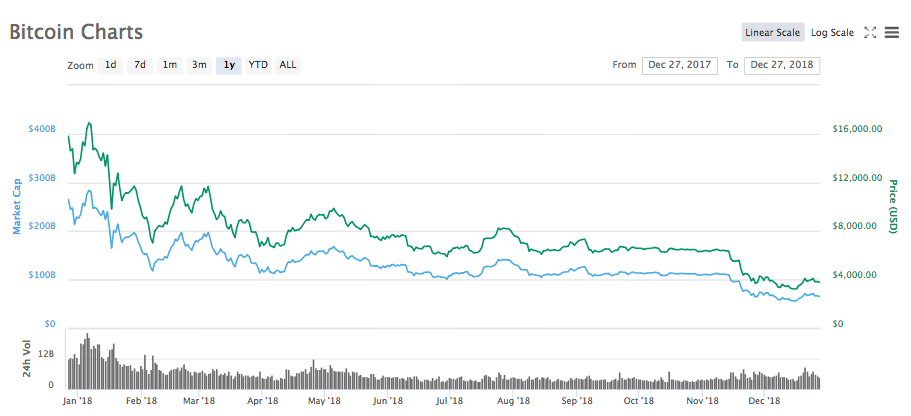
- BTC dropped from $19,000 to $3,500
-
Too much leverage
- Movement away from BitUSD to BitCNY or other assets
- Fewer active accounts.
- Leverage not used as intended
- People borrowed additional collateral, borrowed more bitUSD
- Implementation of BSIP 42 (Price Peg Adjustment)
- Feedback Loops Increase Volatility
- And positive on other side…
- Borrowing on top of borrowing….
- Allegations that people wanted drops (so they could buy assets low)
- Front running on the margin walls
- Complex gaming of the system
LONG TERM EXECUTION
- Long term damage to BTS reputation (scams)
- Lack of effective marketing plan
- Challenging and divisive political environment within BTS
- Too low of penalty for margin call?
- Not enough diversity in collateral?
- EOS launched (stealing people’s interest)
- Auction set to restart it.
Many factors here contributed to one extent or another. This list is mentioned at this point to be inclusive of factors the author is aware of that may be involved. We want to primarily focus on and help quantify and qualify only a few of them. We feel adding some specific data points to the conversation is the most helpful way to move this conversation forward, and equip people and developers with solid knowledge to guide future activity.
Now that many potential factors have been mentioned allow me to elaborate on a few I can help clarify for the discussion while ignoring the others for now.
The Bear Market…
Crypto experienced a long bear market in 2018.
One year Bitcoin Chart…
And a 1 year BitShares Chart…
In Numbers…
BTC.
On December 17, 2017 BTC peaked at $20,089 and fell to a low of $3,191 on December 15, 2018.
This is a 84% drop for BTC
BTS
January 3, 2018; BTS hit $0.90… And fell to $0.034 on December 14, 2018.
This is a 96% drop for BitShares.
It is assumed that the reader is well aware of the overall market drop. It is noted here for historical purposes. One should also note there there are several questions one might need to answer. When should BitUSD break? How big of a fall is the system suppose to be able to take? Proper design frequently takes these factors into account. In much the way automobiles are designed to crumple around the occupants, good system design consider many potential risks and implement safety features to mitigate their impacts..
Volume Numbers
In the great bear market of 2018, there was a lessening of trading volumes on BitUSD and BitCNY as well as less trading on the BitShares DEX overall. These factors greatly contributed to the BitUSD global settlement.
Data Source…
Data numbers were pulled directly from Coin Market Cap. This was pulled for BTS, BitCNY, and BitUSD. It provides an easy source for data. It is noted there may be some issues with recent data of the last several weeks not reflecting all activity. As this is primarily concerned with year to date activity. A note of it will be made here and data for the last few weeks (December 2018) will be taken with a grain of salt.
BTS Volumes…
How many BitShares traded on an average day for each month…
|
Month |
AVERAGE DAILY BTS Volume |
|
2018-Dec |
4,895,861 |
|
2018-Nov |
5,230,814 |
|
2018-Oct |
3,851,637 |
|
2018-Sep |
7,894,918 |
|
2018-Aug |
9,833,609 |
|
2018-Jul |
15,272,958 |
|
2018-Jun |
13,231,280 |
|
2018-May |
23,870,396 |
|
2018-Apr |
26,561,760 |
|
2018-Mar |
9,508,004 |
|
2018-Feb |
26,277,577 |
|
2018-Jan |
65,773,406 |
The number of BitShares on average traded each day have been in a decline. This is not a good trend.
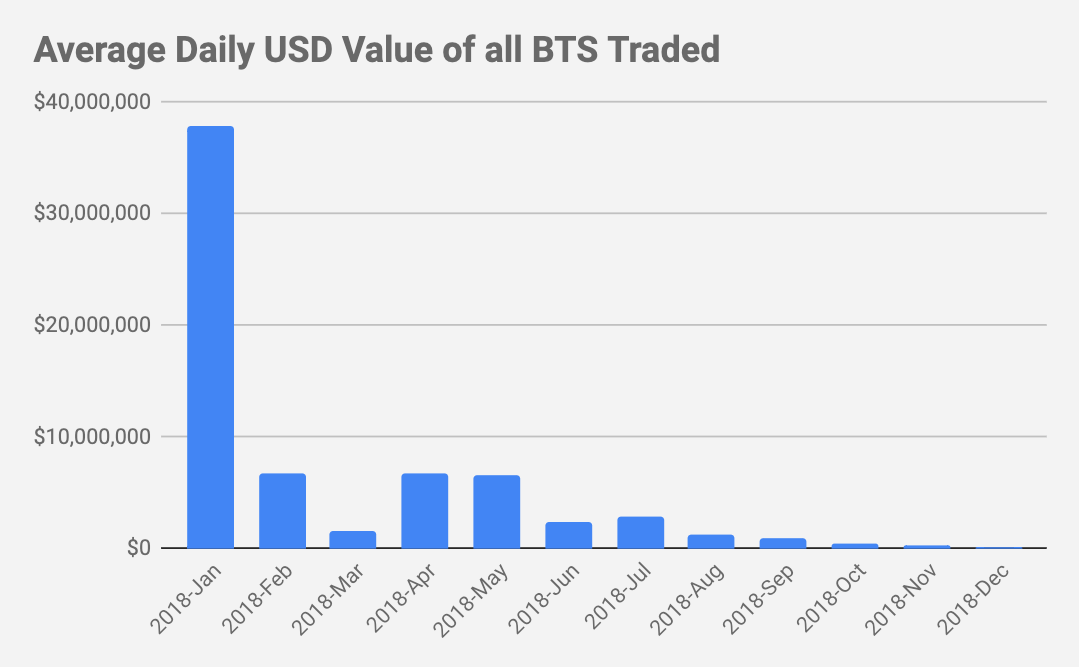
While volumes of BTS changed, the USD value of BTS also changed. Lets convert each BitShares to the USD equivalent value daily and then look at the average daily USD value of BitShares (BTS) activity. This will allow us to see the increase or decline of BTS activity in constant value terms.
| Date | Average Daily Volume of BTS Traded | BTS Price | Average USD Value of BTS Traded Daily |
| 2018-Dec |
4,895,861 |
$0.040 |
$196,615 |
| 2018-Nov |
5,230,814 |
$0.074 |
$359,759 |
| 2018-Oct |
3,851,637 |
$0.103 |
$395,760 |
| 2018-Sep |
7,894,918 |
$0.113 |
$888,685 |
| 2018-Aug |
9,833,609 |
$0.122 |
$1,210,505 |
| 2018-Jul |
15,272,958 |
$0.184 |
$2,864,420 |
| 2018-Jun |
13,231,280 |
$0.171 |
$2,399,953 |
| 2018-May |
23,870,396 |
$0.261 |
$6,533,951 |
| 2018-Apr |
26,561,760 |
$0.213 |
$6,764,767 |
| 2018-Mar |
9,508,004 |
$0.166 |
$1,650,856 |
| 2018-Feb |
26,277,577 |
$0.252 |
$6,698,936 |
| 2018-Jan |
65,773,406 |
$0.556 |
$37,836,341 |
There has been a consistent and steady drop in the USD value of all BitShares that traded on a Daily Basis. Given the overall declines in the general cryptocurrency markets, and BitShares prices, this is not surprising.
This graph more clearly illustrates the above data.
Understanding BitAssets
In order to help understand the context of BitUSD global settlement, we need to look at both BitUSD and BitCNY. Other BitAssets are less significant and will be ignored due to significantly lower liquidity during the observation time period. We also need to look at the amount (Market Cap) of each of these assets, as well as the daily trading volume. There may be a lot of holders, but are there a lot of traders? These assets also compete against each other on the exchange for volume so we need to look at the mixture of these assets to see if traders have moved from one to the other. What we will find is that BitUSD triggered global settlement because of a lack of daily trading volume on BitUSD compared to the market cap. There was not enough liquidity in the market to fill the margin called positions. Before we get there though, we need to first understand each of these assets.
BitAsset Market Cap
How much BitUSD is out there?
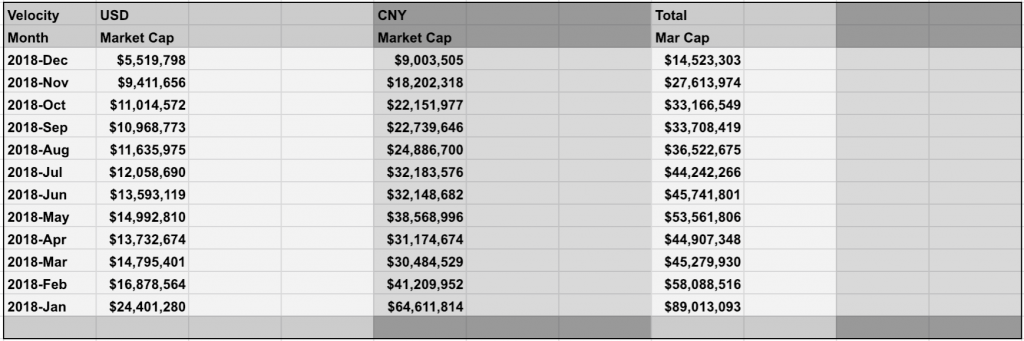
BitUSD analysis
On an average day in January of 2018, there was $24,401,279 of BitUSD issued. (This is a simple average for all days in January.) These totals decline through the year. They decline in a drastic way.
BitCNY Analysis
We also need to look at bitCNY for comparison. These CNY numbers are converted into US dollars (by Coin Market Cap) for an easy comparison. Over the last year BitCNY has always been bigger and also declines more. It declines faster as in November USD fell to 39% of the high and CNY fell to 28% of the high.
Another Chart of the same data.
Both USD and CNY experience huge declines in Market Cap over the the last year. This is not surprising as there was a bear market.
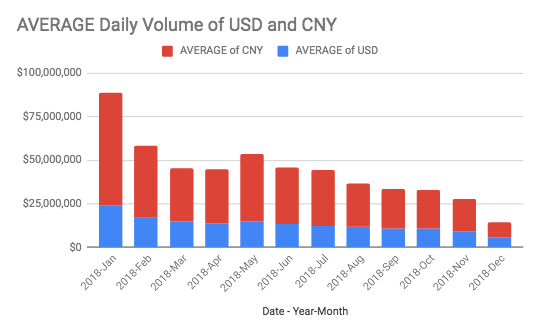
BitAsset Volume…
How much BitUSD is Traded Every Day?
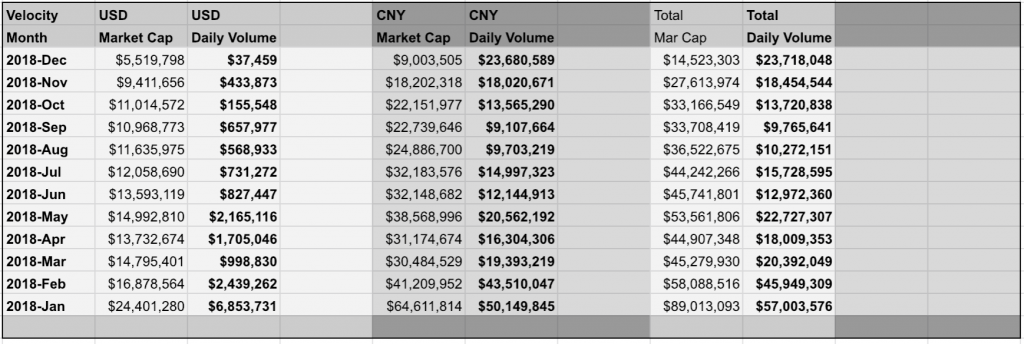
In January 2018, There was 6,853,731 of bitUSD traded daily.
It should be noted these numbers decline all year. They decline significantly. These numbers decline for both BitUSD and BitCNY. They volumes decline faster on bitUSD.
Velocity Of Money…
Another major factor in any economy is the velocity of money. How many times does money change hands? Given both market cap and daily trading it is easy to calculate the average velocity or turnover of money. For perspective, in the US economy, money turns over about 6 times a year. (This has varied from 4 to 11 over the last 60 years.)
By contrast Tether (generally considered untrusted, but used as a convenience) has a velocity of trading about once every day.
This chart, takes the market cap and volume, from the above charts and figures an Average Turns per Day. In January 2018, there was 24 million of bitUSD, with a daily volume of 6.8 million. So each day about 28% of all BitUSD turned over. Or in about 4 days all BitUSD turned over.
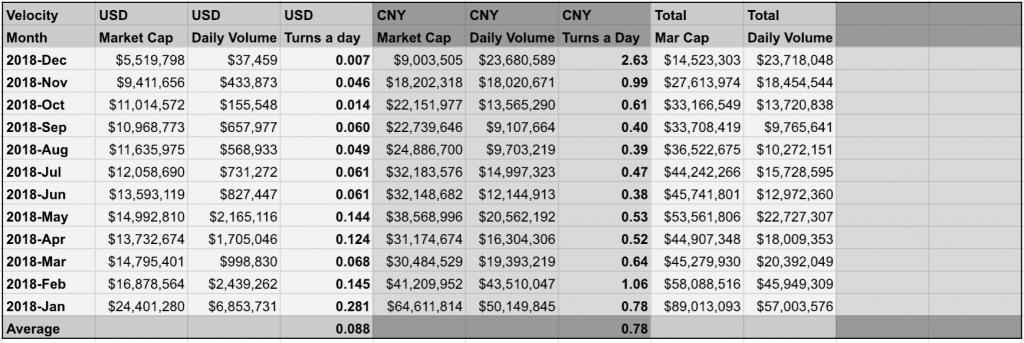
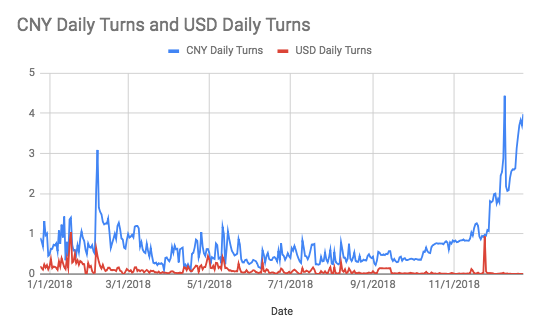
BitUSD Velocity
THESE NUMBERS DROP SIGNIFICANTLY THROUGH THE YEAR. On average about 10% of BitUSD traded on any given day. In October it was about 1 to 5%. This is a major reason for the lack of Liquidity and BitUSD settlement.
BitCNY Velocity
In November 2018, on average every BitCNY traded every day. Overall CNY has a much higher velocity of money than BitUSD does. On Average, for the entire year 78% of all outstanding bitCNY traded every day. Only 9% of BitUSD does. There are several reasons for this. BitCNY is traded on an external exchanges. People prefer more liquid markets.
Liquid Markets…
Traders like liquid markets. It should be noted that one can get a feeling for where people are located in the world by their preference of currencies. It has long been known BitShares has a strong presence in China. Based on Market Cap in January 2018 72% of BitShares traders prefered CNY. Based on volume 88% did.
Many people though can trade either BitCNY or BitUSD.
Let’s get a look at the the last 1 year of trading activity by both Smart Coin Market Cap and Trading Volume.
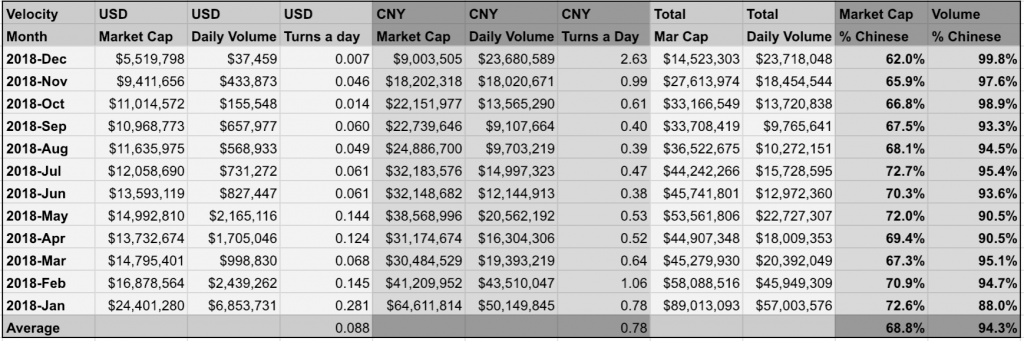
Percent Chinese Market Cap…
Here we see looking at market cap about 68% of Smart Coin Market Capitalization is in Chinese Yuan. It is noted that this percentage falls slightly. The main reason is the BitCNY is both bigger and falls faster than the BitUSD Market Cap. Overall, this is steady and not significant.
Percent Chinese Volume…
Looking at daily trading volume, Yuan makes up 88% of volume in January and approaches 99% in October 2018. Over the course of the year, while USD traded with less and less volume, CNY also dropped, but it held up better. It is particularly troubling in October 2018, 98.8% of Volume was on BitCNY and only 1.2% was on BitUSD. This is significant. This is important. All indications are this one of the main reasons BitUSD went into global settlement.
Days to Cover…
In the stock market, there is a Short Ratio. When a stock is sold short, there is a certain number of days, of all the volume of that stock trading that would be required to cover the short position. Traders monitor this for and sometimes use it as a liquidity and short rally indicator. In a similar way, let’s look at the number of days of average volume that would be required to to pay off all BitUSD or BitCNY debt. This is very similar to velocity of money, it the inverse ratio, but may be easier for some people to understand.
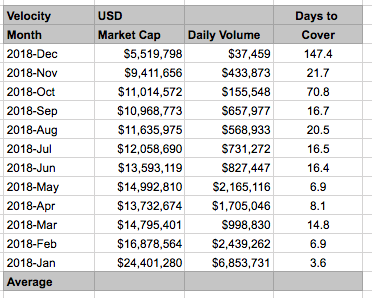
In January, it only took 4 days of “average trading” to “pay off” all USD debt. In October, it would have taken 70 days. (Ignore December numbers, as post settlement volume fell sharply, this may not mean as much.)
Here is another view of the same data.
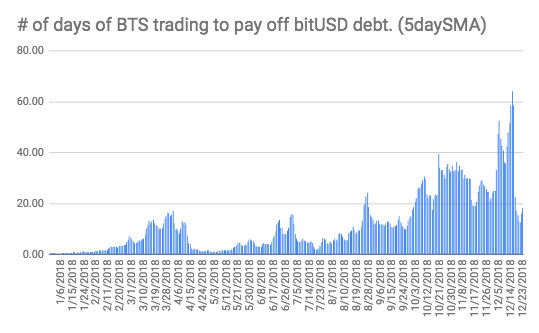
Looking at CNY…
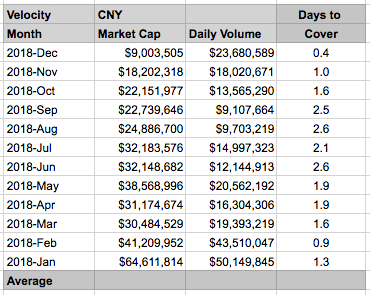
It is noted that CNY has maintained both trading volume and liquidity. It has only taken 1 to 3 days all year to cover the equivalent amount of all debt on bitCNY.
In this way, CNY has maintained liquidity. This contributed to BitUSD experienced global settlement and bitCNY has not yet. It is also noted that major efforts were made to avoid a BitCNY settlement which would have likely happened, had not certain people moved to try to prevent it.
Falling Active Accounts
There are fewer customers. Many people come to BitShares to exchange coins, and then leave. The number of active accounts or the number of accounts that have been active in the last 30 days is much less than the number of total accounts. Unfortunately, numbers here have been confusing and or misleading at times. During the summer, Cryptick calculated 1.3+ million registered accounts, 138,000 accounts with BTS, and 33,000 that had been active in the last month (June 2018). About 6 months later there are about 162,000 accounts with BTS. Following up on the top 64,000 accounts, he found that 72% of them had not traded for the last 6 months. The data showed only 17,920 had a change in BTS balance in the last 6 months. These inactive accounts contained 40% of all BitShares. Unfortunately, these numbers only provide a small glimpse into account activity. Better data and analytics are needed in this regard. It points to the fact that there are a lot fewer customers on the exchange, less transactions and less activity. These are all bad signs, but not completely unexpected in light of the already discussed BTC chart. As an organization, BitShares really need to be able to know, if it is gaining or losing customers, how many and by what means. It should also have metrics for determining how it is doing compared to competitors. Falling active accounts, is worth mentioning here as a potentially significant auxiliary factor.
It is widely known in the stock market, that during downturns people pay less attention to the financial news media, do not like to open brokerage statements and otherwise disengage from bad news. It is not surprising to find similar activity in the cryptocurrency markets.
Interaction of Factors
In incident analysis, many times there are multiple factors and they can work together in good or bad ways. Sometimes, investigators try to determine a percentage each factor contributes.
For example:
Crypto Down Market…..20%
Fewer Customers………10%
Falling Market Cap…….10%
Less Volume…………….20%
Less Liquidity……..…….15%
Other Factors……………25%
However, this is greatly complicated because of complex interactions between each of these factors. Certainly, the Crypto down market caused fewer customers, which caused a falling market cap which caused less volume. Less Liquidity, and fewer people using USD caused a feedback loop, which in turn caused more people to go the more liquid markets of CNY. If one takes each individual factor and looks at what causes it, frequently, the other factors come up as top causes or contributing factors. By looking looking at each factor and the contributing factors that cause them, one can gain a better and more complete understanding. Clearly, I believe the chief problem was liquidity, but I believe that is inclusive of all of these other factors contributing to it as well.
It should be noted that it is likely all of these factors, either directly or indirectly contributed to the low liquidity. Certainly, there are more factors, however, all of these factors seems to play together is such a ways as to multiply and compound the negative effects.
Once one has analyzed, each contributing factor, they can look and see what can be done to and weigh solutions with a cost benefit analysis. Even though we may not be able to stop a crypto bear market, we can offer better customer support, data analytics, advertising or avoid scams.
Lets Review
So after looking at the numbers, it should be clear a lack of liquidity on the BitShares DEX, and BitUSD was a major reason that led to BitUSD global settlement. There was too much debt, and not enough volume on the exchanges to meet the margin sell wall. This resulted in most margined accounts not getting the liquidity they needed to close the positions.
We see that both bitUSD and bitCNY had seen major drops in both market cap and trading volume. BitCNY is much more liquid that BitUSD. It is likely that people used BitUSD as a reserve currency. Since USD is used worldwide a reserve currency, holding money in BitUSD as a reserve is both tempting and likely done. Over time as liquidity dried up in BitUSD, traders went to BitCNY markets for trading. Volume dried up so much, that in October, it would have take 70 days of trading in a 31 day month to fully liquidate BitUSD debt.
This is not sustainable, the lack of market trading in the great downward crypto market was more than BitUSD could handle.
It is not “Anyone’s” “Fault”
The Global settlement is largely the fault of a down market and changes in trading behavior of everyone on the BitShares exchange, and not the result of any individual overleveraged person, business process change or a specific whale. This approach may help build community in response to the event.
Other Considerations…
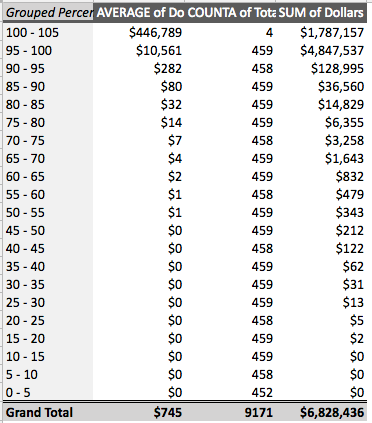
Statistical BreakDown of BitUSD and BitCNY
For the sake of completeness, statistical breakdowns of all BitUSD and CNY holders are provided below.
A new reader should note:
There are 9,174 account with bitUSD and 29,493 accounts with CNY.
Most of these, 80% are effectively empty.
The top 5% of the accounts hold 97% to 99% of all the money.
These accounts are broken down into 21 groups by balance in order to better show the distribution of the money.
Effectively, there are only a few thousand people who hold these assets.
Distributions are similar in bitCNY and bitUSD.
USD holdings by percentile:
CNY holdings by percentile:
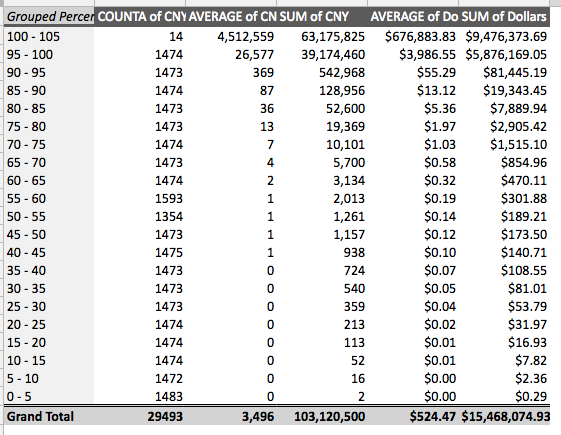
A large portion of the accounts holding money, only hold a tiny fraction. This was basically people who have traded in the past and there is some small amount left over. This data is presented to the reader for completeness. I do not see actionable data to any factors causing global settlement in this data. One could have an interesting political discussion on the “lack of a middle class” in crypto projects, and how this affects human behavior. That said, I am doubtful it is relevant to the global settlement discussion. More benefit might be had by looking at how to better market and acquire additional customers, particularly after this down market ends.
I do think it is important that people realize the size and numbers of people holding BitUSD and associated SmartCoins. These numbers are likely smaller than most people think.
Note: The uppermost group on the chart only includes 99.5-100 percentile. This was initially caused by rounding, but I left it that way because looking at the top few accounts separately is valuable.
Quantity of BTS in SmartCoins
How many BTS are tied up on the blockchain issuing BitAssets? Is this growing or shrinking? Are there obvious trends of concern?
Generally, it is steady and growing slowly… It is generally the same.
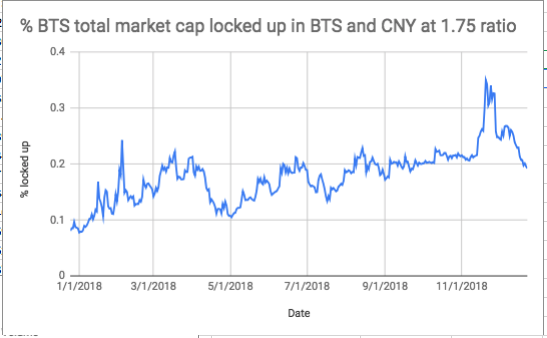
About 10% to 20% of all BTS are locked up in SmartCoin Creation Contracts. It is noted that the spike in November represents the global settlement of BitUSD and is “not covered.” There has been an general increase of BTS locked up in SmartCoin Creation. This has generally, been volatile, and increased on a slow upward trend.
How much risk is passed along in BitUSD?
Given that the BitUSD went into global settlement once in four years. I was able to do some extensive modeling. I will briefly summarize the results here. How much risk is passed along in every BitUSD trade from issuers to buyers? If we were to implement a fee on BitUSD to absorb that risk how much would it be?
Bottom Line. About 0.88%.
Let’s call that 1% -for simplicity.
This was modeled looking at a $2 million default/loss every four years and then raising enough capital on the private market to run a private BitUSD issuing (insurance) company that could both pay back shareholders, holding a significant amount of capital and paying an insurance premium loss of two million every four years. (While I can model this out completely, at this point, trust me, that is the risk premium on BitUSD trades.) (And it is assumed to be the same on all smartcoin trades.) If we wanted to have an appropriate fee, put it into a diversified crypto account to pay for the next global settlement that is what we would have to do. (2 million loss every four years is $500,000 a year, or $1,400 a day) (This risk was then evenly spread over every BitUSD trade to date, and equally invested in a several cryptos BTC, LTC, BTS and USD so that it diversified risk.) (And additional 25% capital was raised to cover all capital requirements and paid at 25% interest annually). (This diversified portfolio was necessary to cover the risk in both up and down markets adequately.) This also assumes that adding such a fee would not affect trader behaviour. If this insurance only was paid for out the general budget it was calculated at about 5% of the BTS daily budget. This was backmodeled over the past four years. If the community wants a write-up, of this, a full explanation would be about 20 pages.
In theory, the idea of a community backed asset pool to backstop potential losses is a very good idea. Insurance, is not readily available for this, at present. I think the community could “self insure” and ultimately should do this, however, I see more pressing and urgent problems plus numerous political difficulties in getting, maintaining and running such an operation.
A Simpler Example:
Building beachfront homes in hurricane zones is potentially foolish. Insurance seems like a great idea. One can easily figure out what the insurance premium would need to be. (If a house costs $100,000 and has a 1 in 100 chance of complete destruction, The risk premium should be about $1,000 a year. (Insurance administration costs add another 20%.) The problem is many people after building a new $500,000 beach home are stunned to see a $6,000+ a year insurance premium. They say, insurance is a great idea, but I can’t afford insurance. Selling this insurance, -without laws requiring it be bought- is difficult. Why should I try to sell an idea to the community, I know everyone is going to reject? That is where we are at.
Public Relations
A Global Settlement is a bad thing for BitShares. Might I suggest one way to handle this incident is to have a multifold response.
- It worked as expected. We designed for this it worked. People were treated fairly.
- We have made some adjustments. We have done (list of three things to be decided by community).
- You are better protected now as we have learned and adjusted.
Context
Did it Work?
Looking at the BitUSD global settlement, it can be very easy to lose faith and say, it didn’t work. Unfortunately, this is taking it out of context.
Historical Banking Panics
Banking panics, depressions, crises and downturns are very common, happening almost every 20 years through history. While readers likely remember the Subprime Financial Crisis of 2008 which inspired BitCoins’ creation, this was not the first banking crisis. The USA had the 2001 World Trade Center Attack, the 2000 Dot Com Bubble, the 1980’s Savings and Loan Crisis, the 1929 Stock market crash. These are very common even seeping into culture with movies of Mary Poppins and It’s a Wonderful Life depicting them. Numerous other countries worldwide, also have a rich history of banking problems.
Crowd and Herd Behavior
Crowd and Herd Behavior is difficult to control. Ever cowboy knows a lighting strike can send a herd of cows stampeding across the plains, running over everything in their path. Modern man is not immune as every few years stampedes happen in Indian temples, western nightclubs, concerts, and sporting events.
Mechanical Context
Airplanes are one of the safest forms of travel, yet planes crash and make headlines. Every time a plane crashes people want to do something and make planes safer. However, there is a very limited weight on an airplane. If you make the plane too heavy it will never get off the ground. There is a limit to the safety systems one can incorporate. One has to establish a fine balance between safety cost, benefit, effectiveness and more. Many airplane engineers have devoted their lifetime to analyzing and considering all of these factors to make safer airplanes, and have done an amazing job of giving air travel to the world.
Design Expectations
The BitUSD global settlement can in a word be explained as shrinking liquidity. (Not enough liquid).
Explanation in Pictures:
Sometimes It might be easier to explain these advanced financial concepts in a simpler way. How about a few pictures:
People make markets work:
Markets take both buyers and sellers. If everyone leaves, a town a ghost town can occur.
Market Capitalization: How big is the lake?
BitCNY was bigger than USD.
Is it growing or shrinking?
Both CNY and USD were both shrinking.
Market Volume: How much water is moving?
The volume dropped.
Money Velocity: How fast is the water moving?
The velocity slowed down.
Liquidity: Getting Enough Water

A plant will dry up if it does not get enough water.
Design Expectations

This overloaded truck from Africa is not safe. This truck is over it’s design limits, it should break. Proper analysis would include a complete mechanical social, economical, political, and cultural consideration and discussion.
Safety Systems Worked

Like an airbag going off in a crash, global settlement worked as expected.
Cryptick’s Ideas to Reduce Risk For BitShares in the Future…
Community Discussion
A greater community discussion needs to take place around that data and numbers contained in this this report. I think these numbers are important, and should be looked at, reviewed and considered in future policy making. I would suggest that markets with more liquidity will be better able to handle the risks, than markets with less liquidity.
Better Metrics
A number of community block explorers and governance features have been developed, I think adding activity metrics to them could be helpful. It would aid in monitoring of the numbers. Specifically, something that looks at the market cap of each coin, compared to the daily trading volume. (Smoothing these numbers with 5 day simple moving averages might be helpful too.) I think these numbers need to be monitored, reviewed and discussed on a regular basis. In a corporate environment, I would recommend that these numbers be calculated and reviewed on a regular basis by the appropriate committee. A well informed governance body will usually be able to determine the best course of action. It is easy to for data and numbers like this to be ignored.
Increase the Collateral Ratio
This is likely the easiest thing. Particularly because people create BitUSD, then buy BTS, put it out as collatortial and then create more bitUSD. This cycle creates highly leveraged positions beyond the intended collateral ratio.
Allow BitAsset issuance to be backed by other Coins…
Yes, This is a change in one of the core BTS principles. However, BTS may fail if it does not adapt. Allowing a diversified holdings of coins (BTC, LTC, ETH, BTS, and more) could improve stability of BTS. In Investing, there are very few free lunches. Holding a diversified portfolio is one of the only “free lunches” in investing.
https://github.com/bitshares/bsips/issues/100
Increased Penalties for Margin Calls
This additional money could go in a special market insurance fund.
Create an Insurance Fund.
About a 5% of the general worker budget invested into a diversified portfolio of Crypto Assets would be necessary to have enough money to weather another BitUSD global settlement in 4 years.
Support Liquidity Efforts
More staggered orders on the DexBot can help.
More Cross Exchange Arbitrage
This can help bring in and take out risk. Spreading it around the crypto world.
Marketing: Get More Customers
As noted in earlier research this summer. The number of users active monthly (33,000) this summer, is much less than most people think.
Customer Support
Customer Support, Anti-Scam research, monitored Telegrams rooms representing low hanging fruit that has never been exploited.
Wait for the Crypto Winter to Pass
Now may not be the time to take action. We may be better waiting and preparing.
Get more Coins on BTS
The more coins traded here, the higher the fundamental value of BTS.
There are more Ideas…
This document was put together mainly to aid in identifying low liquidity and getting that information disseminated through the community. I believe I have found and located several factors that need widespread dissemination and discussion. I believe all policy makers would be better informed after considering the ideas contained here in. This is by no means, a complete list of factors. More work, needs to be done. (It is noted that as the BitShares blockchain is open and holds a history of every trade, an aspiring graduate student or researcher could play back every trade, know every traders positions and do a full analysis of all factors involved.) Hopefully, this report will allow the reader to consider these findings and formulate appropriate responses.
Thank you…
Cryptick1
Other Reading…
https://steemit.com/bitshares/@cryptick/bitshares-has-about-33-000-active-users
This post explains the principles behind compounded borrowing effects, while specifically dealing another crypto, the simple clear explanation is applicable to BTS as well.
https://ian.pw/posts/2018-01-25-maximum-leverage-on-maker.html
About Cryptick1
Cryptick is a trader, crypto analyst, market maker and BitShares enthusiast. He has been active in the BitShares community particularly around the DexBot trading bot project. Crytick1 is part of the DEXbot Cabinet which oversees the DEXbot project. Support for this article comes from the BitShares DexBot worker proposal. In order to get more people involved in BitShares the Cabinet has put out a number of materials, resources and educational articles that help people to understand BitShares. Primarily, the DEXbot is about providing liquidity to the marketplace, however many things are needed including clear analytics, reporting, and more. Feeling that there was a massive need for in-depth understanding on this subject, Crypick put together this article. He also wishes to disclose a potential bias, and/or conflict of interest. It should be noted that Crypick’s opinions, -although well thought out and well reasoned- could be biased from his viewpoint optimism and understanding on these important issues.